Report Highlights: The most commonly used weapons in homicides in the U.S. are firearms.
- On average, firearms accounted for 78% of all mechanisms used in homicides between 2018 and 2025.
- Knives accounted for 8% of all homicide mechanisms in the U.S. between 2018 and 2024.
- Wyoming and Maine were the only two states in 2024 where firearms were used in fewer than 50% of homicides.
Related Studies: Accidental Shooting Statistics, Gun Violence Statistics, Gun Deaths in the U.S.: At-Risk Demographics
Ammo.com provides accurate data from reputable sources. You can view the sources used for this article HERE.
Methodology
This analysis uses data from the CDC WONDER database, which compiles death information by state and at the national level. The CDC includes justifiable homicides in its totals. CDC WONDER does not specify weapon type. It instead describes the mechanism of injury, which we refer to as the weapons they are most likely to represent.
CDC WONDER is a more reliable source for homicide totals than the FBI Crime Data Explorer, which is why we used it to produce our findings.
National and state percentages vary due to suppression values. The CDC reports lower totals at the state level due to suppression rules (totals withheld when the underlying count is too small to reliably report). Percentages and totals may therefore vary between state-aggregated data and national totals.
Data for 2025 were partial and provisional. Some states have yet to fully report mechanisms of homicide. These delayed classifications mean that 2025 figures are unreliable, and should accordingly be used only for directional estimates.
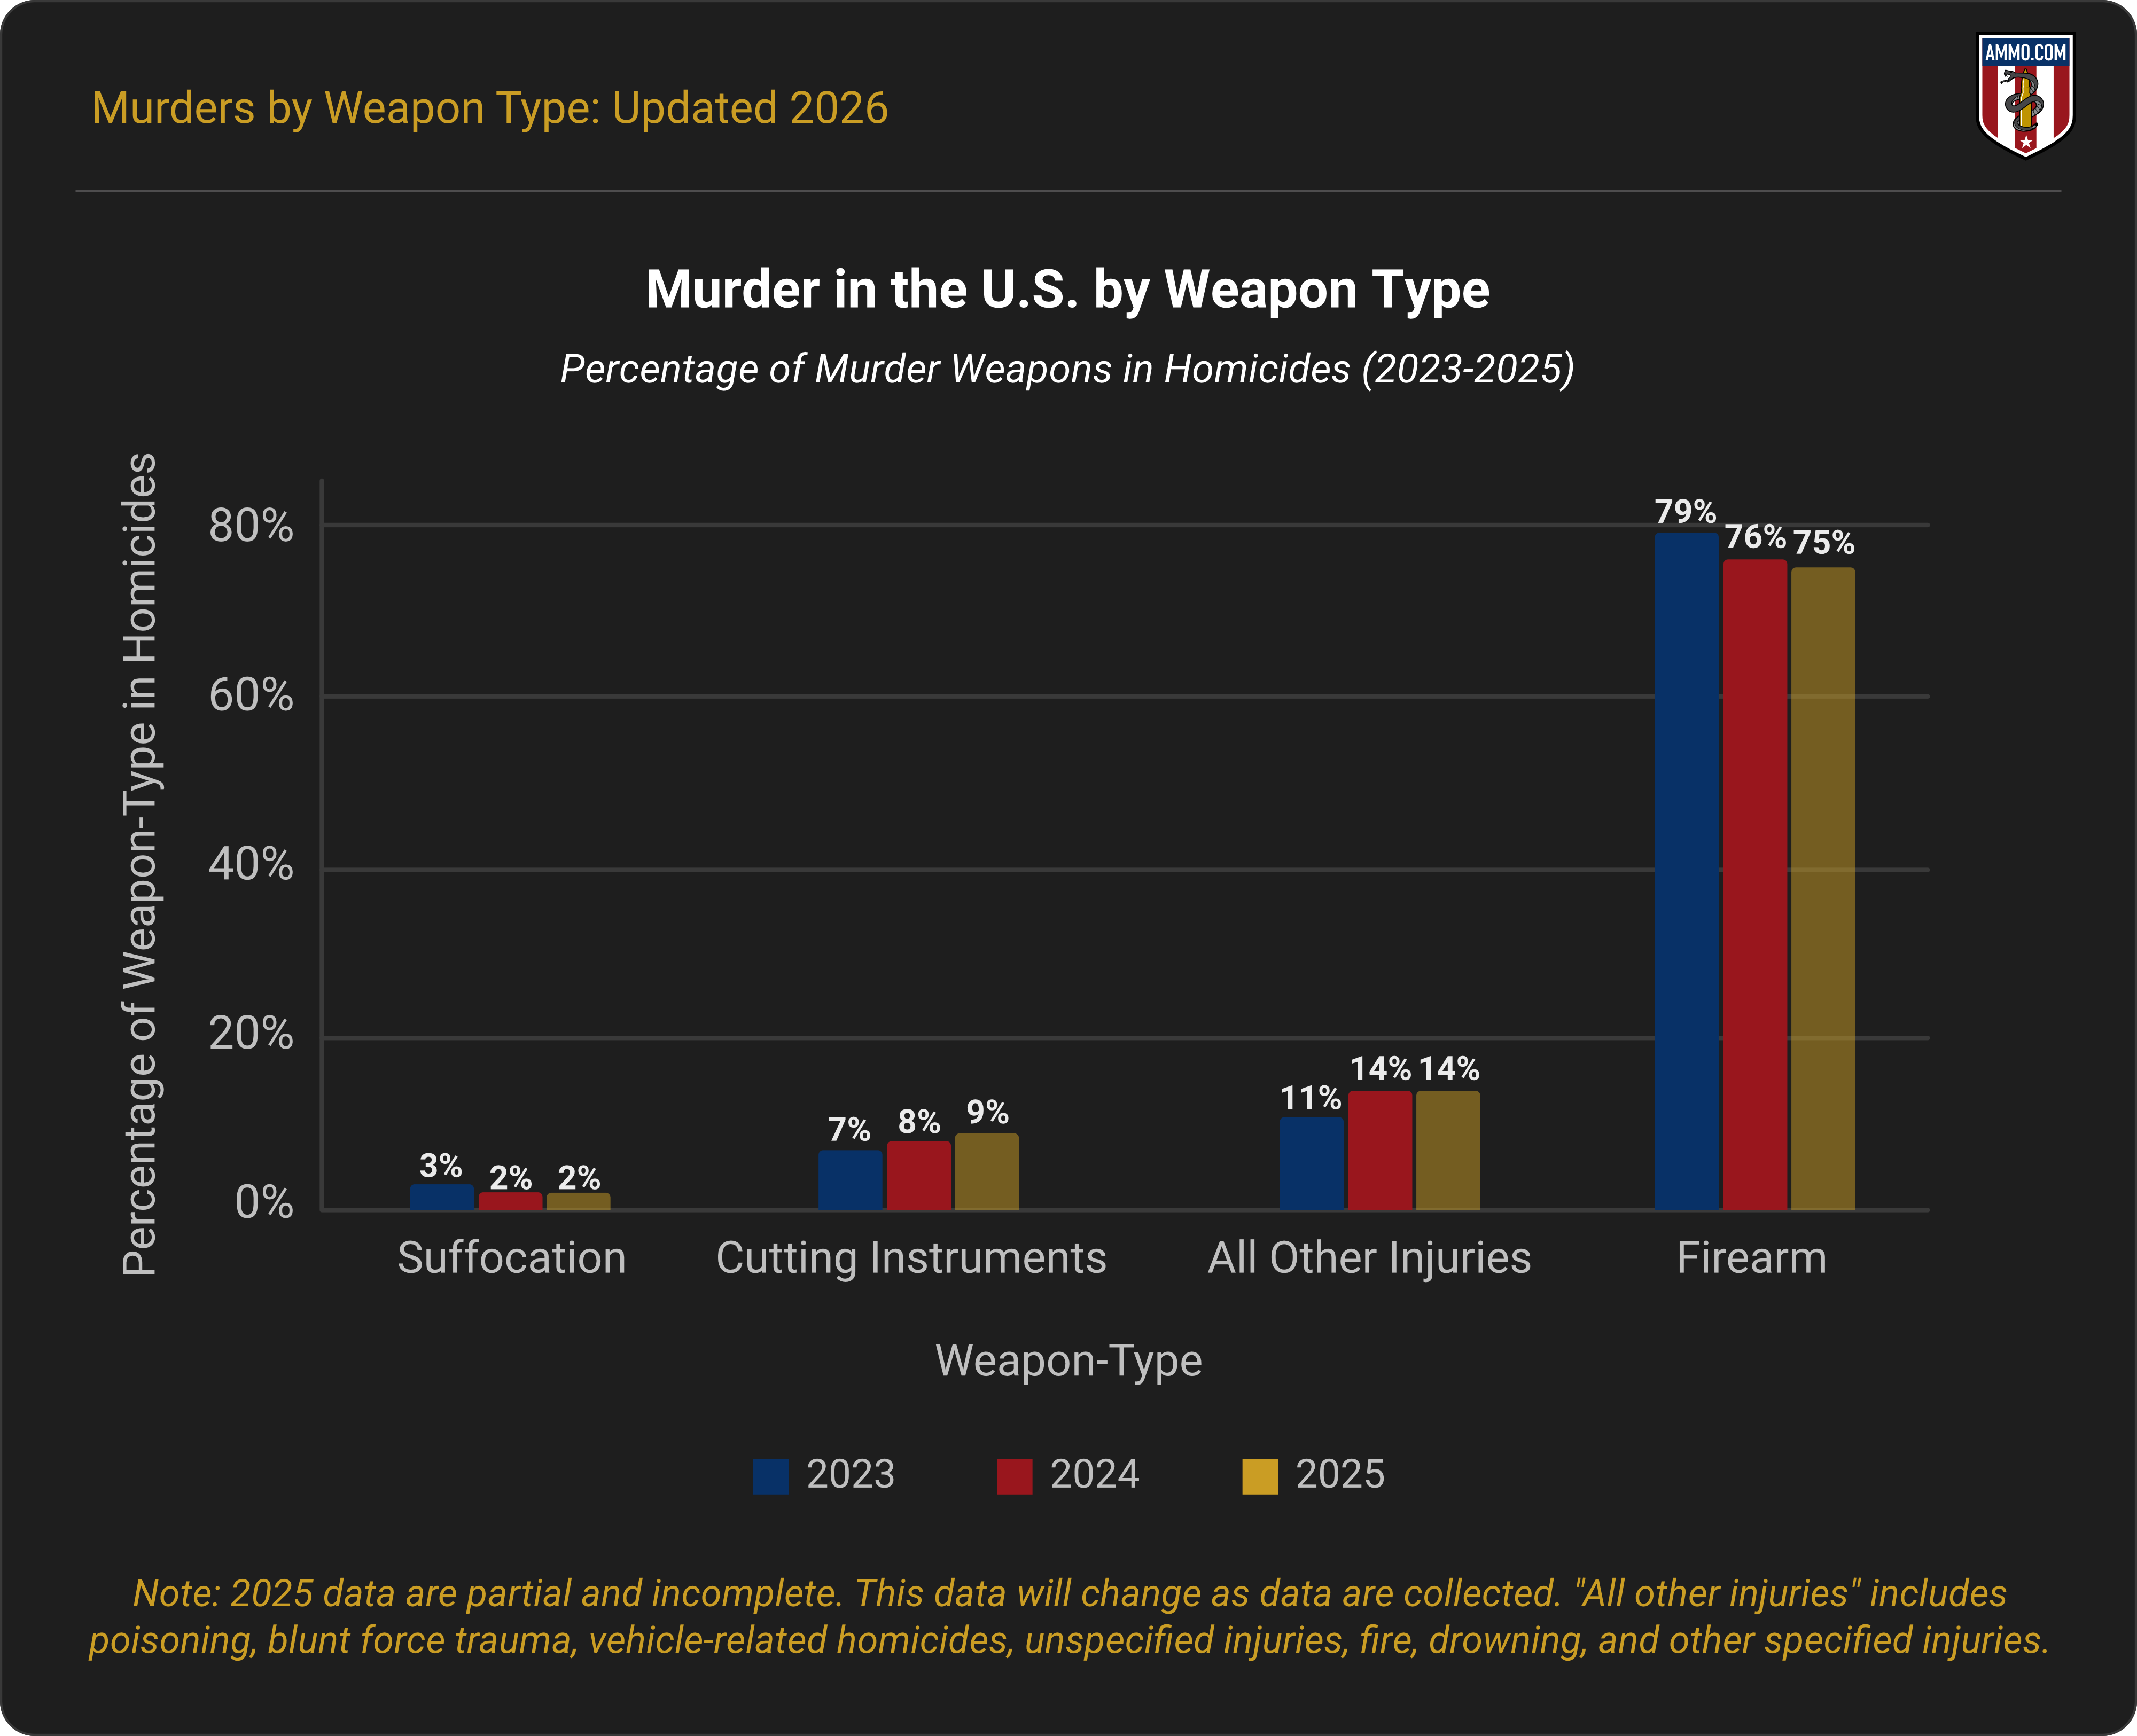
Murders in the U.S. by Weapon Type
In 2024, the CDC reported 20,162 homicides in the U.S. Firearms were involved in 76% of cases; cutting instruments, 8%; suffocation, 2%. Individually counted, other injury types accounted for a small fraction of all homicides (poisoning, fire, falls, vehicles, etc.), but accounted for 14% of all homicides when combined.1
In 2023, the United States recorded 22,830 homicides. Firearms were involved in 79% of cases; cutting instruments, 7%; unspecified injuries, 6%; suffocation, 3%; blunt force injuries, 2%.1
Although 2025 data are incomplete, with some states having yet to report homicide mechanisms at the time of writing (early 2026), 75% of all homicides reported involved a firearm, and 9% involved a cutting instrument.2
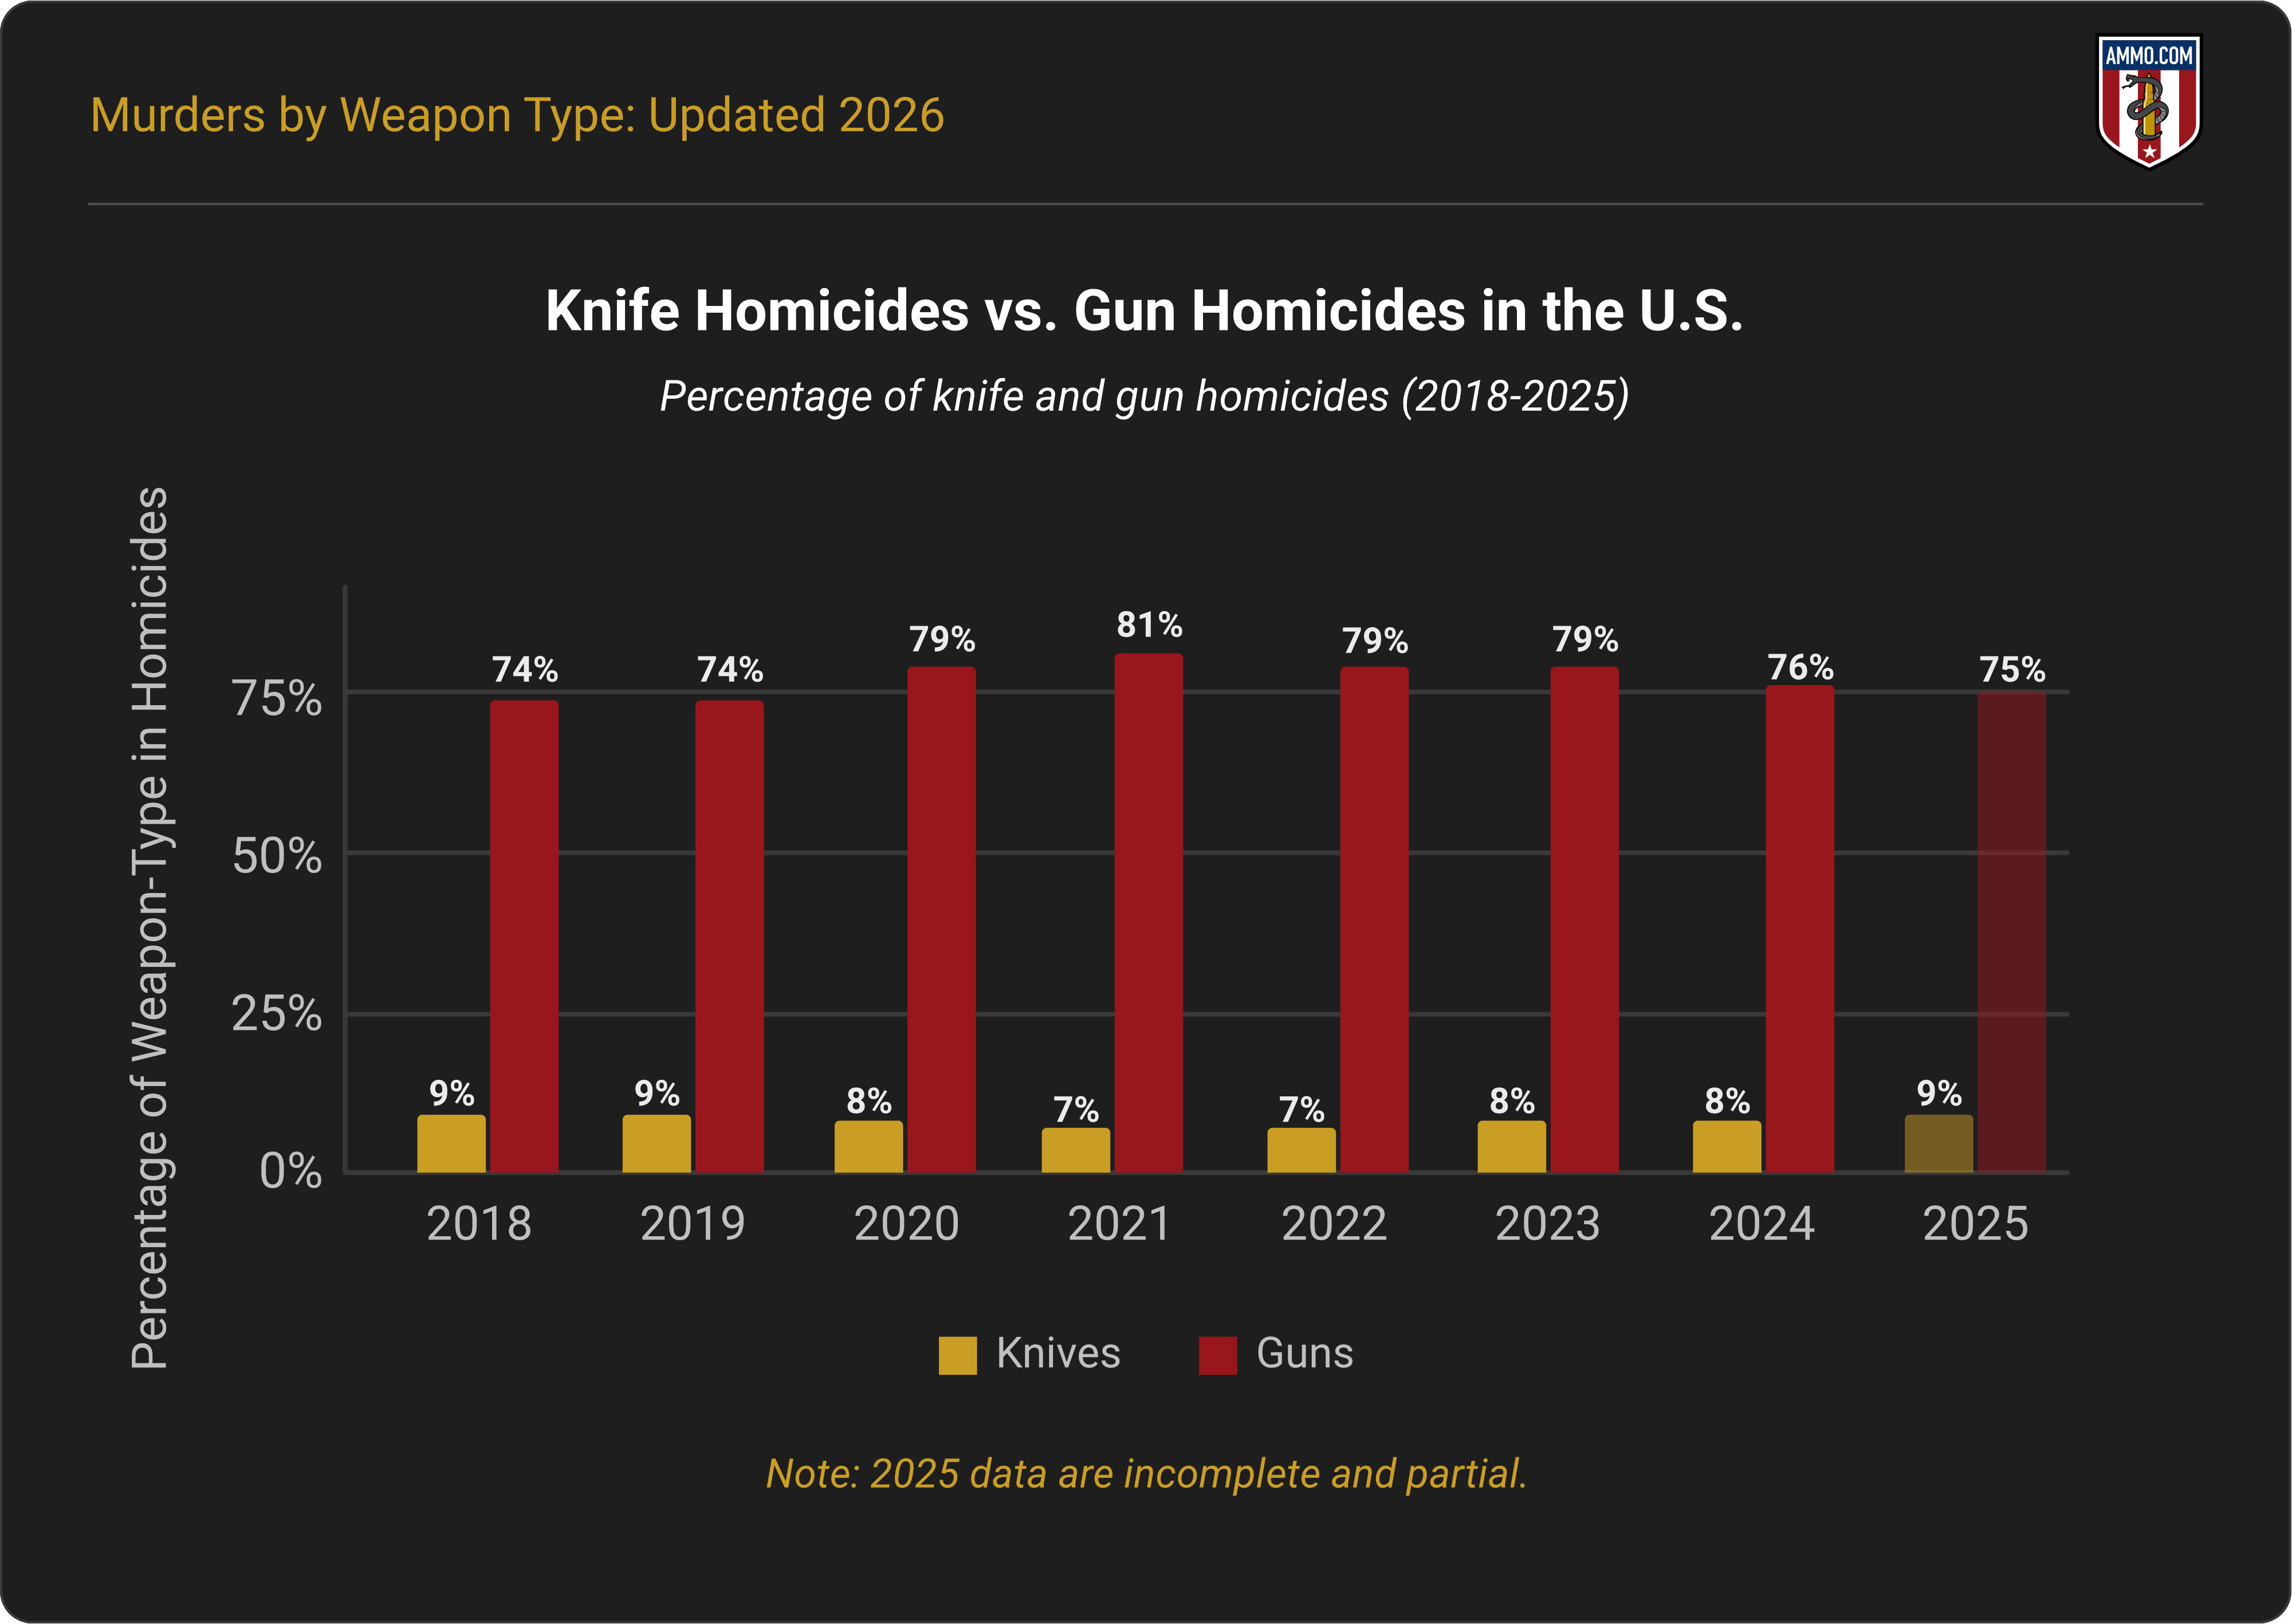
Knife Homicides vs. Gun Homicides in the U.S.
According to CDC WONDER, firearms and cutting instruments were used in most homicides in the U.S. between 2018 and 2025. Of the 156,419 homicides reported during those years, 78% involved firearms. Knives and other cutting instruments were used in 8% of homicides nationwide.1
The total rate of homicides in the U.S. during that timespan was 6.7/100k. Gun homicide rates averaged 5.2/100k, while stabbing deaths averaged 0.5/100k.1, 2
| Homicide Mechanisms in the U.S., 2018 – 20251, 2 | ||
|---|---|---|
| Weapon Type (Injury Mechanism) | Rate per 100K | Weapon-Type % |
| Firearm | 5.2 | 77.8% |
| Cut/Pierce | 0.5 | 8.0% |
| Unspecified Injury | 0.4 | 6.0% |
| Other specified, not elsewhere classified Injury | 0.2 | 2.5% |
| Suffocation | 0.1 | 1.9% |
| Struck by or against | 0.1 | 1.1% |
| Poisoning | 0.1 | 0.8% |
| Other specified, classifiable Injury | 0.1 | 0.8% |
| Fire/Flame | 0.0 | 0.5% |
| Other land transport | 0.0 | 0.4% |
| Drowning | 0.0 | 0.1% |
| Fall | 0.0 | 0.0% |
| Hot object/Substance | 0.0 | 0.0% |
Number of Knife Homicides in the U.S. by Year
On average, there are between 1,600 and 1,800 knife or stabbing-related homicides in the U.S. each year.
FBI Supplementary Homicide Reports include knife or cutting instrument deaths from 2015 to 2019. The FBI Crime Data Explorer contains information on knife deaths from 2020 to 2022. According to these data, there were an average of 1,641 knife homicides between 2015 and 2022.3, 4
- 2018: 1,542
- 2019: 1,476
- 2020: 1,739
- 2021: 1,819
- 2022: 1,630
FBI data collection relies on agency reporting, and often undercounts the number of homicides each year. According to CDC WONDER, there were an average of 1,796 stabbing-related homicides annually between 2018 and 2024.1
Here are the numbers of people who died from sharp object injuries during that timespan:
- 2018: 1,718
- 2019: 1,702
- 2020: 2,063
- 2021: 1,895
- 2022: 1,800
- 2023: 1,704
- 2024: 1,694
Percentage of Knife Homicides in the U.S.
On average, knife- and stabbing-related mechanisms accounted for 8% of all homicides in the U.S. between 2018 and 2024. Firearms accounted for an average of 77% of homicide mechanisms during that same period.1
Murders by Weapon Type by State
2024 state-level data (excluding suppressed states) show that Alabama, Arkansas, Georgia, Illinois, Kentucky, Louisiana, Mississippi, Missouri, North Carolina, South Carolina, Tennessee, and Virginia had the highest rates of firearm-related homicides, ranging from 81% to 87%.1, 2
Wyoming and Maine were the only two states with fewer than 50% firearm-related homicides in 2024. Hawaii, Montana, New York, South Dakota, Vermont, and Alaska had fewer than 60% firearm-related homicides in 2024.
In 2025, firearms continued past the year’s trends of being used in the most homicides. Although CDC WONDER’s 2025 homicide mechanism data are incomplete at the time of writing (with some states missing entirely), current data suggest that Alaska, South Carolina, Wisconsin, and Alabama had firearm usage at or near 90% of all reported homicides.2
Wrap-Up
Firearms are consistently used in more homicides than other objects in the U.S. Despite fluctuations in homicide totals, injury mechanisms (e.g. firearm, cut/pierce, suffocation, etc.) remain statistically consistent.
Sources
- CDC WONDER Database 2018-2024
- CDC Provisional WONDER Database 2018-2026
- FBI Expanded Homicides 2013-2019
- FBI Expanded Homicides: Crime Data Explorer
Article posted with permission from Ammo.com